How do I compare treatment groups in microscopy images?
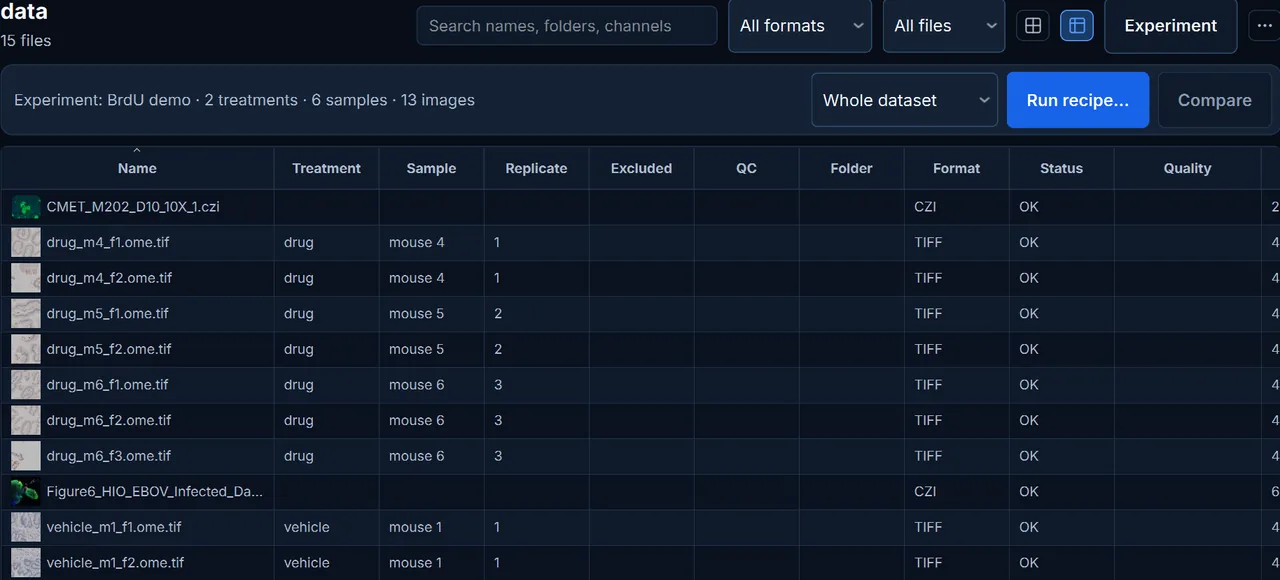
Open the folder in SlideScope and organise its images into an experiment: treatments, samples and replicates, from a sample sheet or from suggestions based on the file names. With SlideScope Plus, run one Quantify recipe on every image, then choose Compare: SlideScope averages each sample's images, plots one dot per sample with the mean and SD of each treatment, and runs Welch's t-test and Mann-Whitney for two treatments or ANOVA and Kruskal-Wallis for more.
Why is n the number of samples and not the number of images or cells?
Images and cells from the same animal, patient or culture are not independent, so counting them as separate observations inflates n and makes differences look more certain than they are. SlideScope averages the images of each sample first and runs the tests on one value per sample.
Which measurements can I compare?
Any value the Quantify recipe produced for every image: object count, density per mm², percent positive, H-score, Allred score, mean object area and mean intensity per channel.
Is experiment analysis included in every plan?
Organising images into an experiment is included in every plan. Running one recipe across the experiment, comparing treatments and reviewing the run's results need SlideScope Plus. Quantify itself, on one image or a folder, is in every plan.
Does SlideScope replace a statistics package?
No. It runs the standard two-group and multi-group tests on one value per sample and reports them with the data behind them. It does not run pairwise post-hoc tests after ANOVA, mixed models or power calculations; export the sample table to Prism, R or Python for those.